
Visualize How Models Compare to the Leader
Source:R/compare_to_leader.R
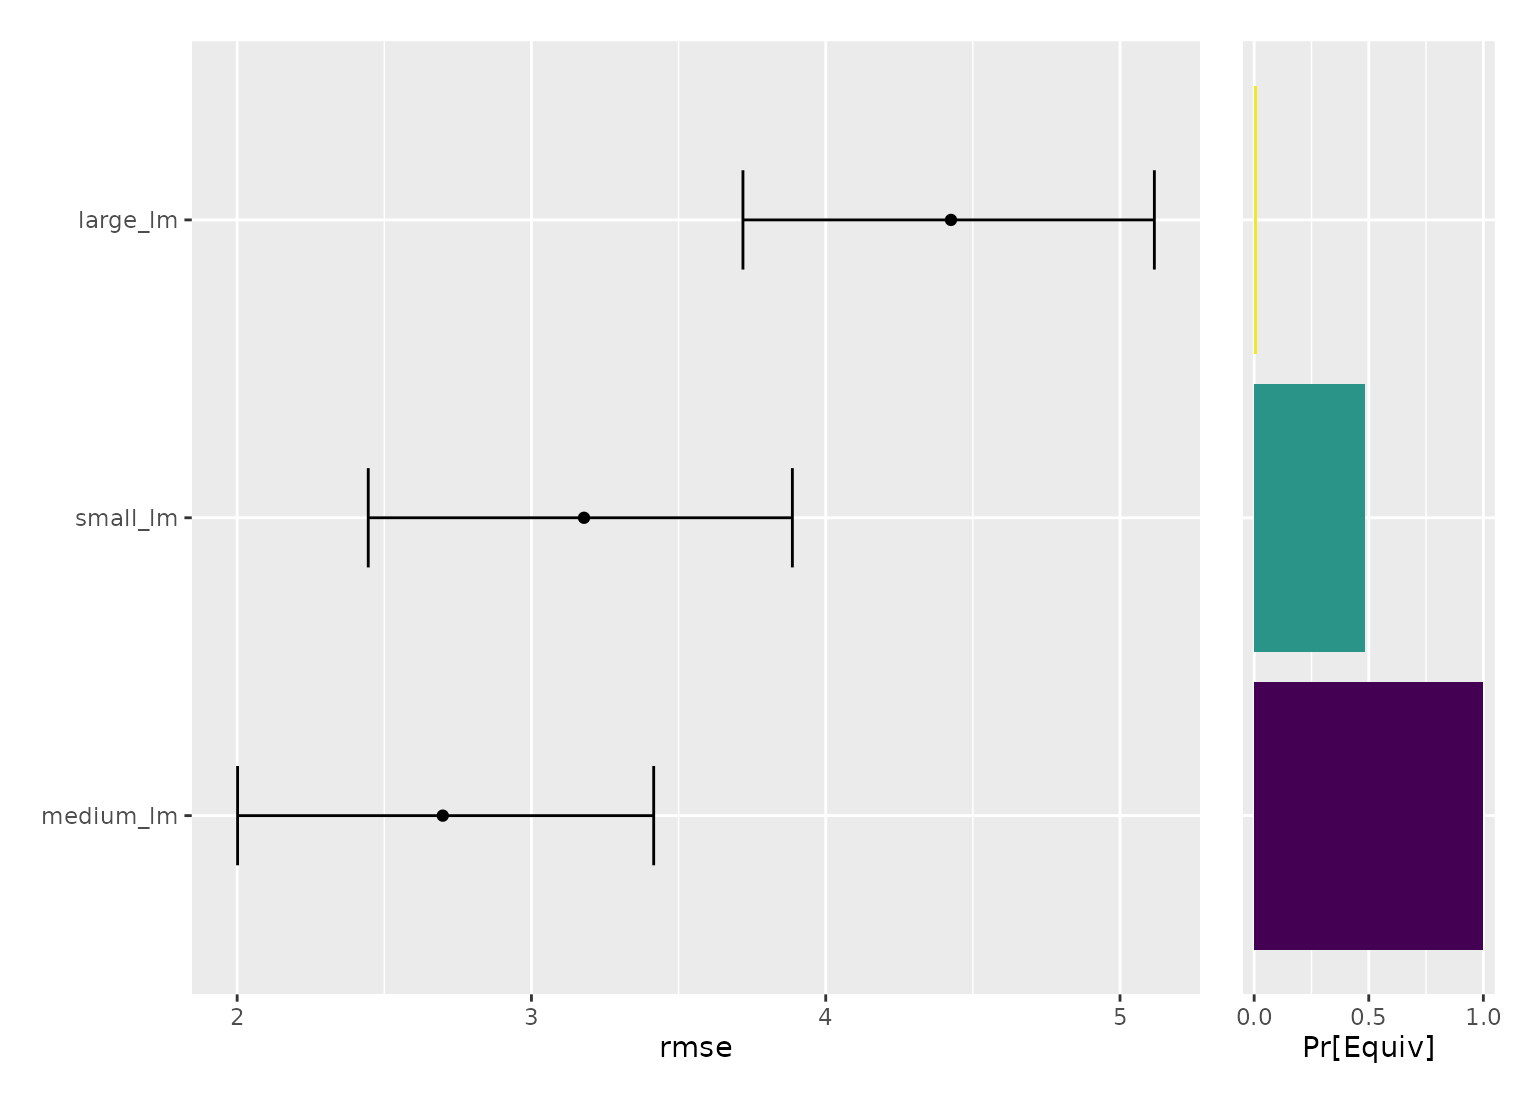
autoplot.compare_to_leader.RdTwo panels are drawn side-by-side: the posterior distribution of the metric for each model (as a median and credible interval) and the probability that each model differs from the leader.
Usage
# S3 method for class 'compare_to_leader'
autoplot(object, zero_bar = 0.01, metric_label = NULL, ...)
Arguments
- object
An object produced by
compare_to_leader().- zero_bar
A single number giving the shortest bar to draw in the right-hand panel. Probabilities of zero would otherwise draw a bar with no length, which reads as a missing row rather than a zero. Set it to
0to draw the probabilities exactly.- metric_label
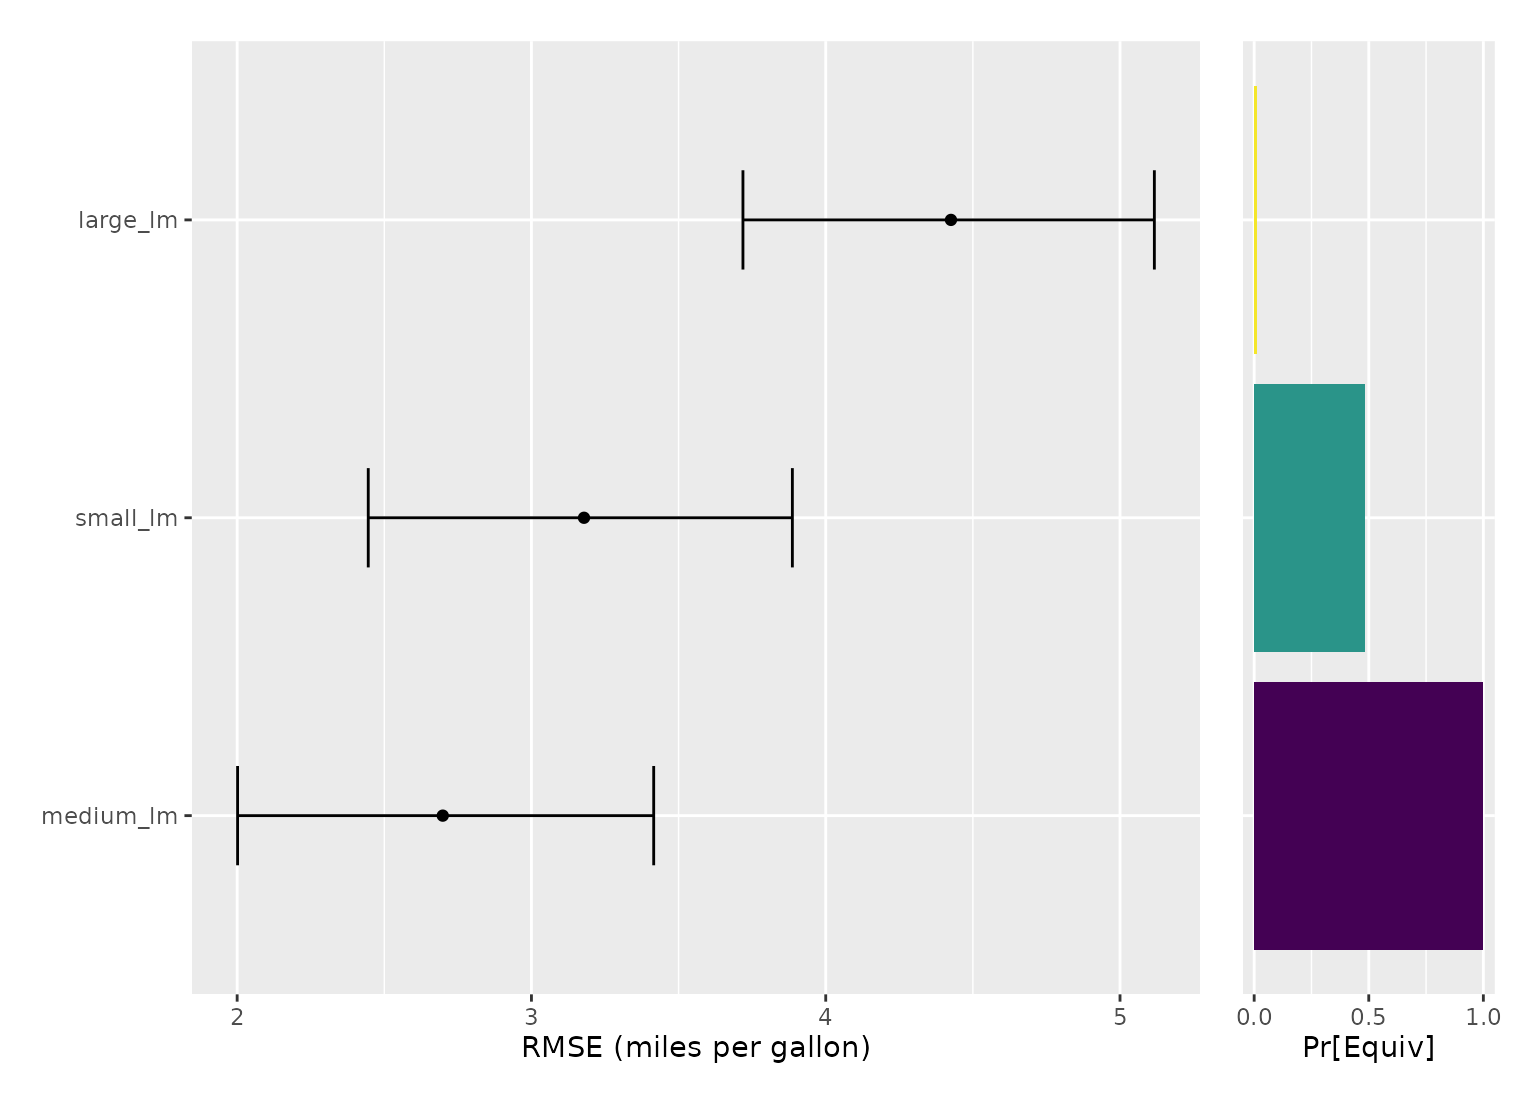
A single character string or expression used to label the x-axis of the left-hand panel. If
NULL, the name of the metric recorded byperf_mod()is used. This is useful for spelling a metric out or adding units, such as"RMSE (kg)".- ...
Not currently used.
Value
A patchwork::patchwork object made from two ggplot2::ggplot()
objects.
Details
The right-hand panel shows pract_equiv when compare_to_leader()
was given a size and pr_worse otherwise. In both cases the fill scale is
oriented so that darker bars are better.
Note that zero_bar makes a bar's length depart from the probability it
represents: any value below zero_bar is drawn at zero_bar. The fill
colour is always mapped to the true value, and the leader always has a
pr_worse of exactly zero.
Models are ordered by rank along the y-axis, running from the worst at the top to the leader at the bottom.
The left-hand panel is labelled with the metric name when one is available.
A perf_mod object always records one, but a compare_to_leader() result
that has been through a dplyr verb will have lost the attribute, in which
case the axis falls back to "Posterior". Use metric_label to set it
directly.
Examples
library(parsnip)
library(rsample)
library(workflowsets)
set.seed(1)
folds <- vfold_cv(mtcars, v = 5)
# \donttest{
mpg_models <-
workflow_set(
preproc = list(
small = mpg ~ wt,
medium = mpg ~ wt + hp,
large = mpg ~ .
),
models = list(lm = linear_reg())
) |>
workflow_map("fit_resamples", resamples = folds, seed = 2)
set.seed(4321)
mpg_post <- perf_mod(mpg_models, metric = "rmse", refresh = 0, chains = 2)
mpg_res <- compare_to_leader(mpg_post, size = 0.5, seed = 2)
autoplot(mpg_res)
 # Spell the metric out and give it units:
autoplot(mpg_res, metric_label = "RMSE (miles per gallon)")
# Spell the metric out and give it units:
autoplot(mpg_res, metric_label = "RMSE (miles per gallon)")
 # }
# }