Visualize the Posterior Distributions of Model Statistics
Source:R/posteriors.R
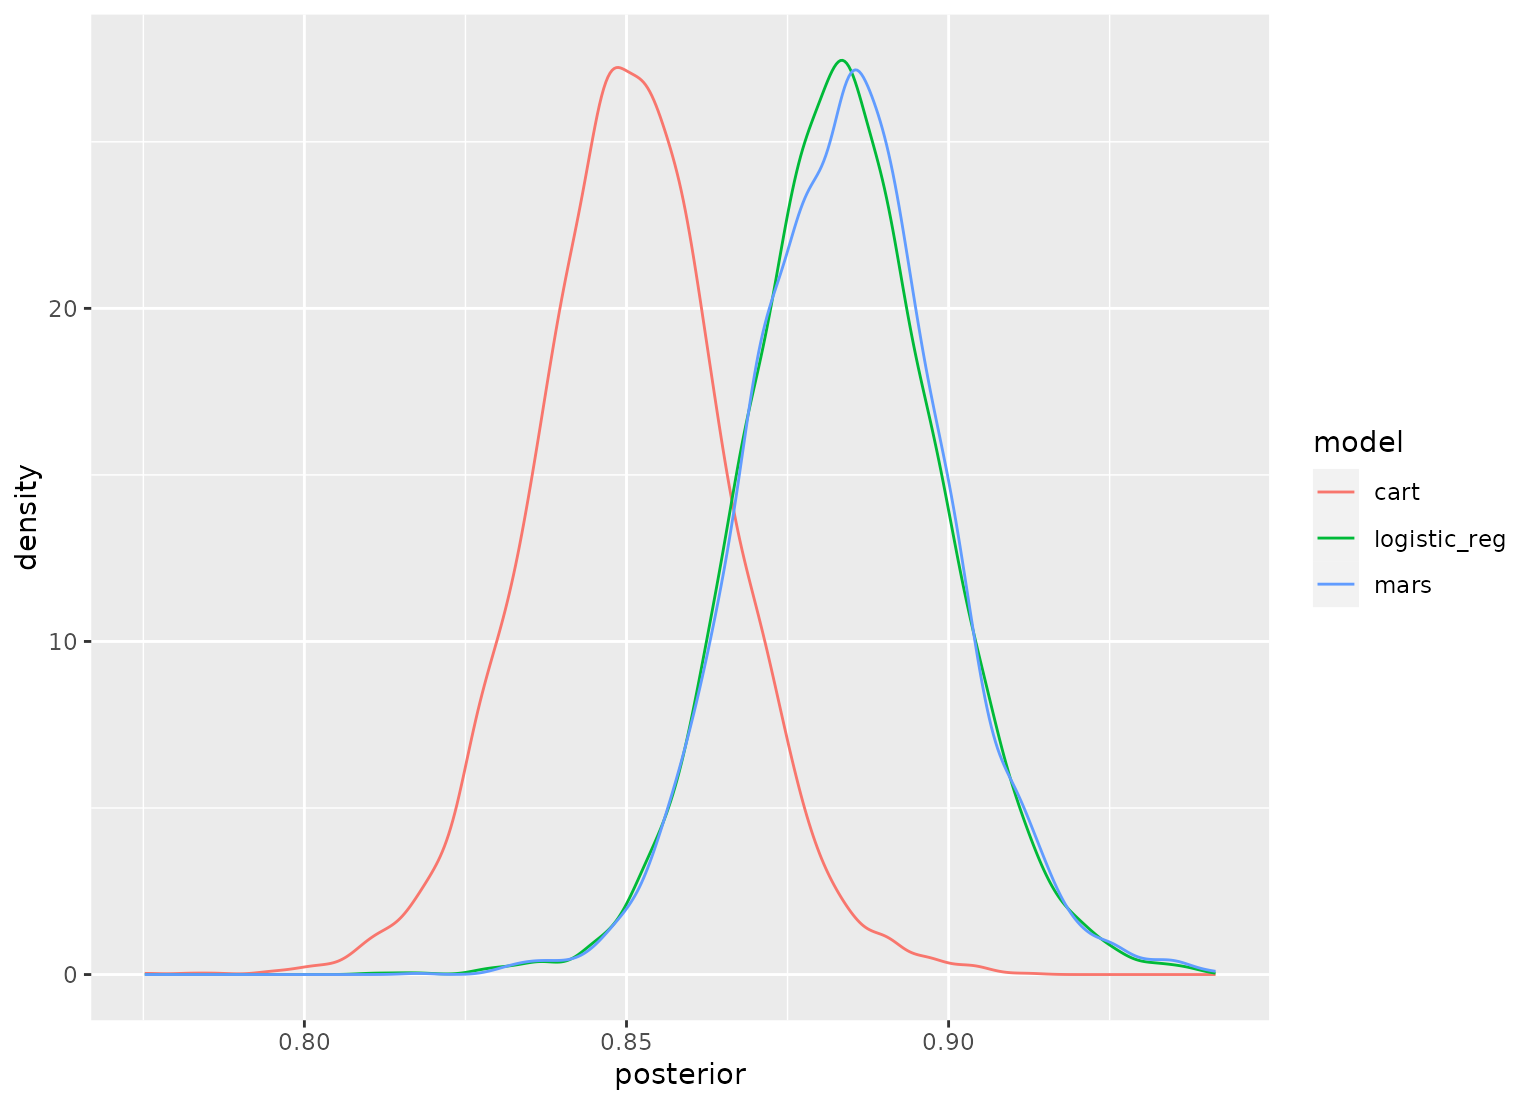
autoplot.posterior.RdFor objects of classes posterior and perf_mod, autoplot() produces a
simple plot of posterior distributions. For workflow set objects, there are
several types of plots that can be produced.
Arguments
- object
An object produced by
perf_mod(),tidy.perf_mod(), or a workflow set with computed results.- ...
Options passed to
geom_line(stat = "density", ...).- type
A value of one of:
"intervals"(for model rank versus posterior probability using interval estimation),"posteriors"(density plots for each model), or"ROPE"(for practical equivalence probabilities versus workflow rank).- prob
A number p (0 < p < 1) indicating the desired probability mass to include in the intervals.
- size
The size of an effective difference in the units of the chosen metric. For example, a 5 percent increase in accuracy (
size = 0.05) between two models might be considered a "real" difference.
Value
A ggplot2::ggplot() object.