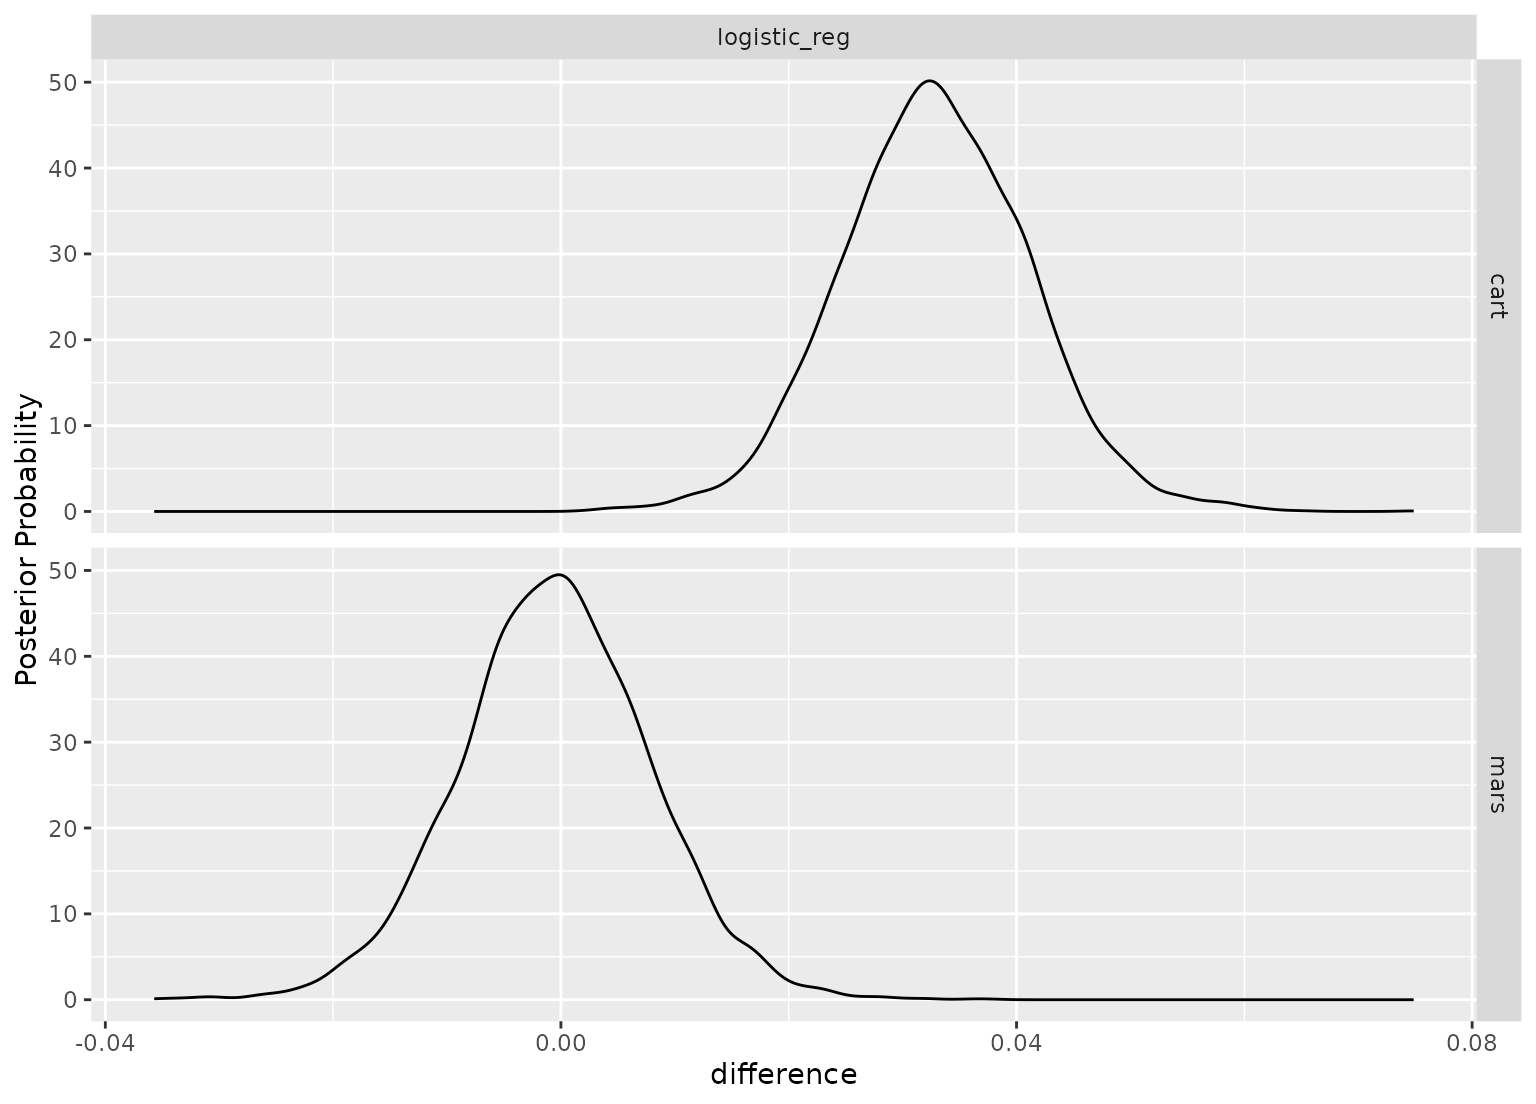
Visualize the Posterior Distributions of Model Differences
Source:R/contrasts.R
autoplot.posterior_diff.RdA density is created for each contrast in a faceted grid.
Usage
# S3 method for posterior_diff
autoplot(object, size = 0, ...)
Arguments
- object
An object produced by
contrast_models().- size
The size of an effective difference. For example, a 5\ "real" difference.
- ...
Options passed to
geom_line(stat = "density", ...).
Value
A ggplot2::ggplot() object using geom_density
faceted by the models being contrasted (when there are 2 or more contrasts).
